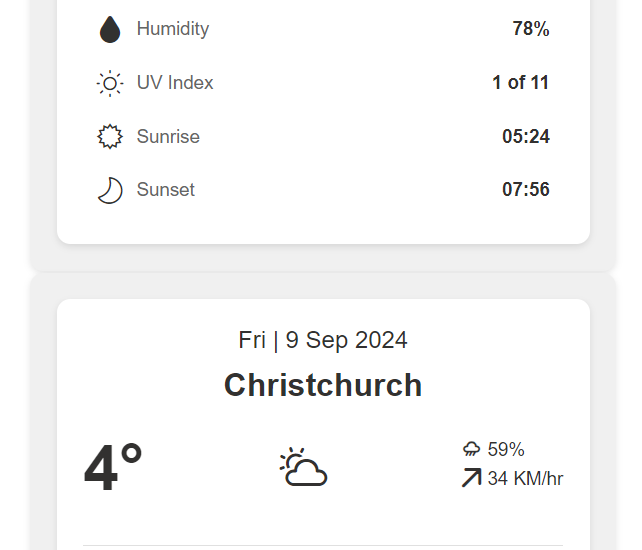
Weather forecasting is an essential part of daily planning for many people, whether it’s deciding what to wear, when to travel, or how to plan activities. With SharePoint List view JSON formatting, we can create a visually appealing and functional weather forecast dashboard that displays all necessary weather metrics clearly and intuitively.
SharePoint List Structure for Weather Forecast
To build the weather forecast display, I designed a SharePoint list with several key columns that capture different aspects of the weather for any given location. Below is the column structure:
| Column Name | Type |
|---|---|
| Title | Single line of text |
| Location | Single line of text |
| Temperature | Number |
| Weather | Choice (Sunny, Cloudy, Rainy, Snowy) |
| Wind | Single line of text |
| Humidity | Number |
| UVIndex | Single line of text |
| Sunrise | Single line of text |
| Sunset | Single line of text |
| Rain | Number |
Features of the Weather Forecast Template
This weather forecast template covers a wide range of meteorological data, providing users with all the information they need at a glance. Let’s explore some of its key features:
- Location and Temperature Display
- The Title and Location fields display the specific region or city and can be customized to reflect any area.
- The Temperature field uses a number to represent the current temperature, rounded to the nearest whole number.
- Weather Condition and Choices
- The Weather column is a choice field that allows users to select from predefined weather types such as Sunny, Cloudy, Rainy, or Snowy. This adds visual clarity and helps categorize the weather with ease.
- Wind and Humidity Metrics
- The Wind field captures wind speed and direction, which can be useful in predicting how comfortable the day will feel.
- Humidity gives a percentage value for the moisture in the air, crucial for understanding air quality and how the temperature might feel.
- UV Index and Sunlight Information
- The UVIndex column informs users about the intensity of ultraviolet radiation, helping them take precautions for skin protection.
- Sunrise and Sunset fields provide exact times for when the sun will rise and set, helping plan outdoor activities more effectively.
- Rain Prediction
- The Rain column shows the amount of rainfall expected, giving users an idea of how wet the day might be.
Source Code
To explore the full JSON template used to create this weather forecast experience, you can access it on GitHub via the link below:
With this JSON formatting, the weather data can be displayed with colors, icons, and visual indicators that help users quickly understand the forecast. For example, different weather types (Sunny, Cloudy, Rainy, Snowy) could be represented with specific icons, while the temperature could be color-coded based on intensity (e.g., blue for colder temperatures, red for hotter temperatures).
Why Use This Solution?
This weather forecast template offers an efficient and flexible way to track and display weather data. Whether you’re building a dashboard for internal teams, event planning, or simply providing useful data to your users, SharePoint List view formatting allows for a clean, concise, and functional presentation.
Conclusion
With SharePoint’s List view JSON formatting, creating a weather forecast solution is easier than ever. The ability to display detailed metrics such as temperature, wind, humidity, and sunrise/sunset times makes this solution a valuable addition to any modern workplace. Try implementing this setup to keep your team or community informed and prepared for any weather conditions.
