In the world of finance, data is king. Whether you’re managing budgets, tracking investments, or assessing the financial health of your organization, having the right data at your fingertips is essential. However, not all data is created equal, and the way it’s presented can have a significant impact on your ability to make informed decisions.
In many cases, financial data is presented in a columnar format. While this format has its uses, it can also be challenging when it comes to analysis. Imagine you have a dataset that looks something like this:
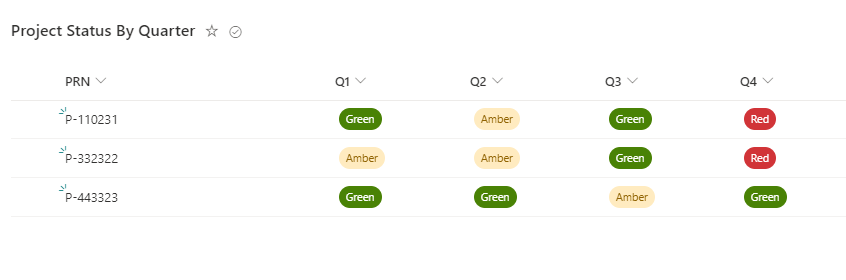
The Challenge: Columnar Financial Data
In this columnar format, each project’s financial performance is broken down by year and quarter. While this might be suitable for some purposes, it’s not the most user-friendly format for in-depth analysis. If you want to assess quarterly performance or create pivot tables for reporting, this format can be less than ideal.
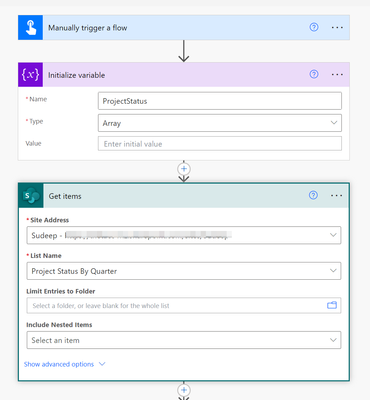
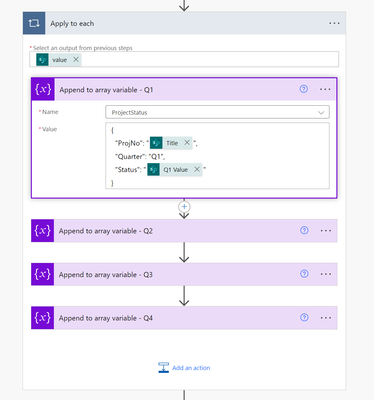
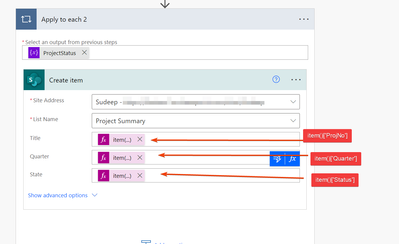
The Solution: Transposing Data with Power Automate
The solution to this challenge lies in data transformation. Specifically, we can use automation tools like Power Automate to transpose the financial data, effectively changing it from columns to rows. Here’s an example of how you can do it: